
A snapshot of Castle Point and Rochford
90,524 people live in Castle Point1. It has four towns: Benfleet, Canvey, Hadleigh and Thundersley. Castle Point has areas of great wealth alongside some of the most deprived areas in England. Yet there is a strong sense of community within the Borough. Its many assets are valued and have brought new opportunities to the area, such as Hadleigh Country Park. This hosted the Mountain Biking during the London 2012 Olympics and has since been developed into a world class sports facility offering a range of sports activities, walking, and cycling trails. Despite its dense urban nature, there remains large areas of public open space, marshland, and woodland.
87,627 people live in the Rochford District1. It has several major towns including Rayleigh, Rochford, and Hockley, together with smaller parishes. It is of a more rural nature compared to Castle Point, with around 14% of people living in rural town and fringe, village, or hamlet and isolated dwellings. The District has vast areas of green space and is home to the RSPB Wallasea Island Nature Reserve.
There are many commuters living in Castle Point and Rochford. Two separate train operators serve the area which connect to the city of London in less than an hour.
| Type | Castle Point | Rochford |
|---|---|---|
| Life expectancy at birth (males)2 | 80.2 years | 81.6 years |
| Life expectancy at birth (females)2 | 83.5 years | 84.4 years |
| Total population (ONS mid-2020 estimates)1 | 90.524 | 87.627 |
| % of population aged 0-15y1 | 17.1 | 17.3 |
| % of population aged 16-64y1 | 57.5 | 59.5 |
| % of population aged 65+y1 | 25.4 | 23.2 |
| % 16 – 64-year olds Equality Act core disabled3 | 23.2 | 14/6 |
| % pupils receiving SEN support | 9.4 | 9.7 |
| % of total population living in the 20% most deprived areas4 | 9 | 1.8 |
| % of total population living in the 20% least deprived areas4 | 21.7 | 53.2 |
| % of pupils eligible for free school meals (Jan 2021 school census)5 | 14.8 | 12.4 |
| % of pupils achieving a good level of development (2019 data)6 | 73.1 | 79.3 |
| No. of Universal Credit Claimants (Jan 2021)7 | 6271 | 5054 |
| No. of households receiving a statutory homelessness service8 | 288 | 28 |
Although the overall picture for Castle Point and Rochford is relatively good in terms of health, it is not the same for everyone everywhere. Some people are more likely to experience poor health because of their circumstances, and this is where we need to target more of our resources.
For example, since 2007 Castle Point has seen a rise in deprivation, particularly on Canvey Island. Here, some electoral wards are among the most deprived in England. On the other hand, people living in the more rural areas of the Rochford District may not have easy access to green space, leisure centres, sports, and social groups because they are not available near to where they live. They might also be difficult to get to on public transport. These are all factors that can affect health and wellbeing.
Understanding the wider determinants of health
Our health is determined by a range of factors. These include:
- Age and genetic factors
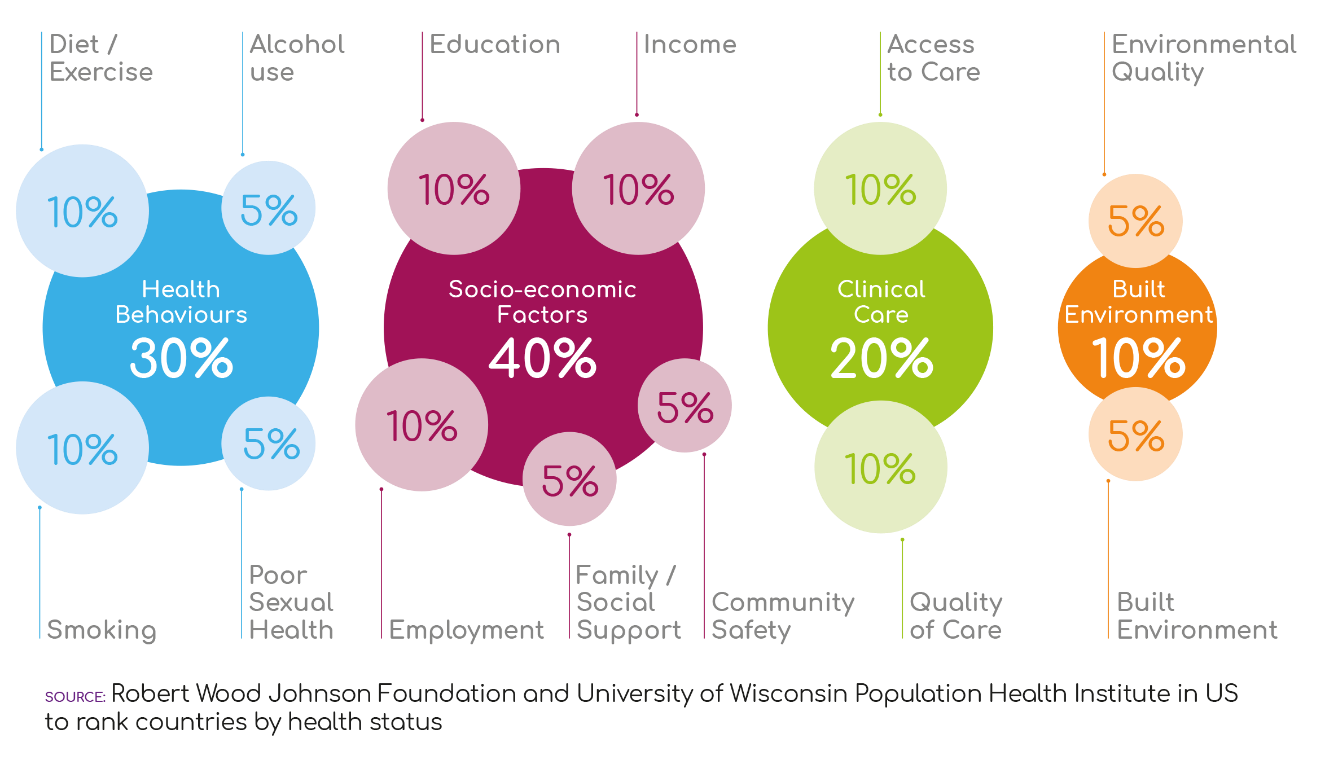
- Health behaviours (e.g. diet, exercise, smoking and alcohol use)
- Socio-economic factors (e.g. education, income, and employment)
- The built environment
- Clinical care
The social, economic, and environmental factors are known as wider (or social) determinants of health. These influence our health more so than other factors. Researchers say that socio-economic factors are the biggest influencer (40%) of a person’s health and wellbeing. This is more than health behaviours (30%), clinical care (20%) and the built environment (10%).
The differences in the care that people receive, and the opportunities they have to lead healthy lives, can lead to differences in health outcomes - we call these health inequalities.
One of the most important measures of health inequality is life expectancy. This is closely linked to a person’s socio-economic circumstances, which are measured by level of deprivation.
In Castle Point, males living in the least deprived areas can, at birth, expect to live 7.3 years longer than males living in the most deprived areas. For females, this gap is 6.4 years.
In Rochford, however, there is a bigger gap in life expectancy for females (7.6 years) than for males (5.9 years).
| District | Ward with highest life expectancy (years) | Wards with lowest life expectancy (years) | Difference in life expectancy (years) |
|---|---|---|---|
| Castle Point (males) | Boyce (82.3) | Canvey Island South (75.0) | 7.3 |
| Castle Point (females) | St James (87.6) | Canvey Island South and St Peters (81.2) | 6.4 |
| Rochford District (males) | Hawkwell West (84.4) | Roche South (78.5) | 5.9 |
| Rochford District (females) | Hawkwell West (88.1) | Roche North and Rural (80.5) | 7.6 |
9Data obtained from PHE Fingertips Public Health Profiles - PHE
Another key measure of health inequality is the amount of time people spend in good health over the course of their lives. Healthy life expectancy (HLE) is a measure of this that estimates the average number of years that an individual is expected to live in a state of self-assessed good or very good health.
Inequalities in healthy life expectancy are even wider than inequalities in life expectancy. People in more deprived areas spend, on average, more of their lives in poor health.
In Castle Point, there is a 12.3-year gap in healthy life expectancy at birth for males and almost a nine-year gap for females10.
Similarly, in Rochford, there is a 12-year gap in healthy life expectancy at birth for females and a 10-year gap for males10.
If we compare across the two districts, there is approximately a 15-year difference between the wards with the highest and lowest healthy life expectancy10.
| Local Authority | Ward with highest HLE | Ward with lowest HLE | Inequality in HLE |
|---|---|---|---|
| Castle Point (males) | St George’s (69.7) | Canvey Island Central (57.4) | 12.3 years |
| Castle Point (females) | St James (70.4) | Canvey Island West (61.6) | 8.8 years |
| Rochford District (males) | Hockley West (72.1) | Rochford (62.1) | 10.0 years |
| Rochford District (females) | Hockley West (76.1) | Rochford (64.0) | 12.1 years |
10Data sourced from Health state life expectancy by 2011 Census wards in England and Wales - Office for National Statistics (ons.gov.uk) and Life expectancy by census ward (ons.gov.uk)
By working together, we can address some of these wider determinants. Our aim is to reduce health inequalities, but COVID-19 is likely to have made them worse. This means we have even more work to do to tackle this as we move forwards.
For example, in 2020 Castle Point and Rochford saw large increases in unemployment.
| Age Band | Castle Point | Rochford |
|---|---|---|
| 16-24 | 580 | 510 |
| 25-49 | 1495 | 1175 |
| 50-54 | 250 | 235 |
| 55-59 | 200 | 205 |
| 60-64 | 175 | 155 |
| 65+ | 35 | 20 |
| Total | 2735 | 2300 |
| % change from 2019 totals | +189 | +191% |
112020 data obtained from Unemployment and Job Market profiles – Essex Open Data
Changes in circumstances such as this have further increased the demand for services. Coupled with pressures on funding, this means that we need to find new ways of doing things.
Health and Wellbeing Board member Sarah Mills, Interim Head of Transformation for Castle Point & Rochford Clinical Commissioning Group, speaks about the importance of everyone having access to the support they need: